HFTS-2 Final Report — what the Wolfcamp field experiment actually found
What it is. HFTS-2, the second Hydraulic Fracturing Test Site, is a US-DOE / NETL + GTI Energy field experiment with sixteen industry partners, in the Wolfcamp shale of the Permian Delaware Basin, Loving County, Texas. Occidental operated it over about four years. It is one of the most heavily instrumented hydraulic-fracturing science sites ever built. The full 343-page final report and all data are public on EDX. This is the short version.
The site in one picture
Section titled “The site in one picture”Eight new producing wells, with roughly 7,500 ft laterals spaced 660 ft apart, were landed in the Upper and Middle Wolfcamp. Alongside them sat two legacy Bitterroot parent wells drilled about three years earlier, and two dedicated science wells: a vertical pilot hole named Boxwood-5PH and a slant well named Boxwood-6S that was cored straight through the stimulated rock volume. Permanent fiber-optic cable was installed in three wells — two horizontal and one vertical.
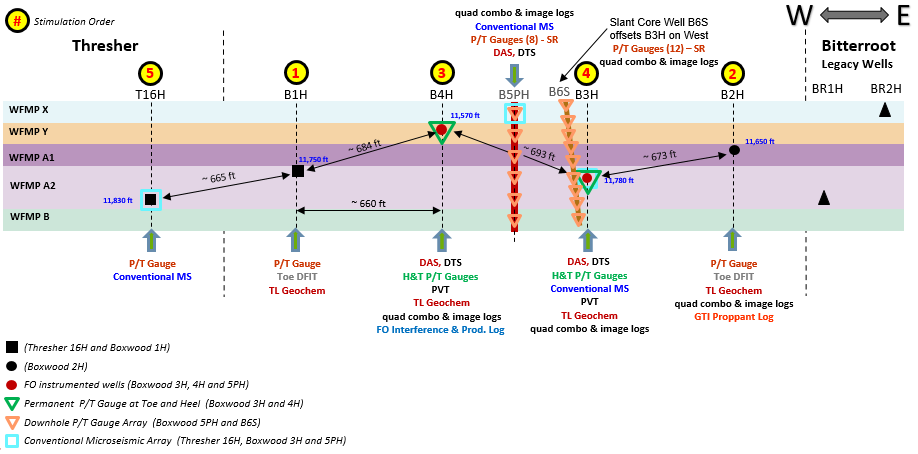 Fig 105 — Overview of the HFTS-2 dataset: child wells Boxwood-1H through 4H, the legacy Bitterroot parent wells, the fiber wells, and the microseismic wells.
The research dataset is enormous: microseismic, 1,500 ft of whole core with 950 ft drilled straight through fractured reservoir, diagnostic formation injection tests, advanced logs, geochemistry, downhole gauges, several completion designs, and many fiber-optic surveys. Everything was integrated to pin down fracture geometry and depletion.
How the fiber sees a fracture
Section titled “How the fiber sees a fracture”The workhorse observation is the low-frequency DAS strain-rate waterfall. As a hydraulic fracture from a neighboring well approaches the fiber, the strain-rate image shows a characteristic signature: an approaching extensional front, a heart-shaped extension at interception flanked by compressional stress-shadow lobes, then polarity reversal and relaxation once pumping stops.
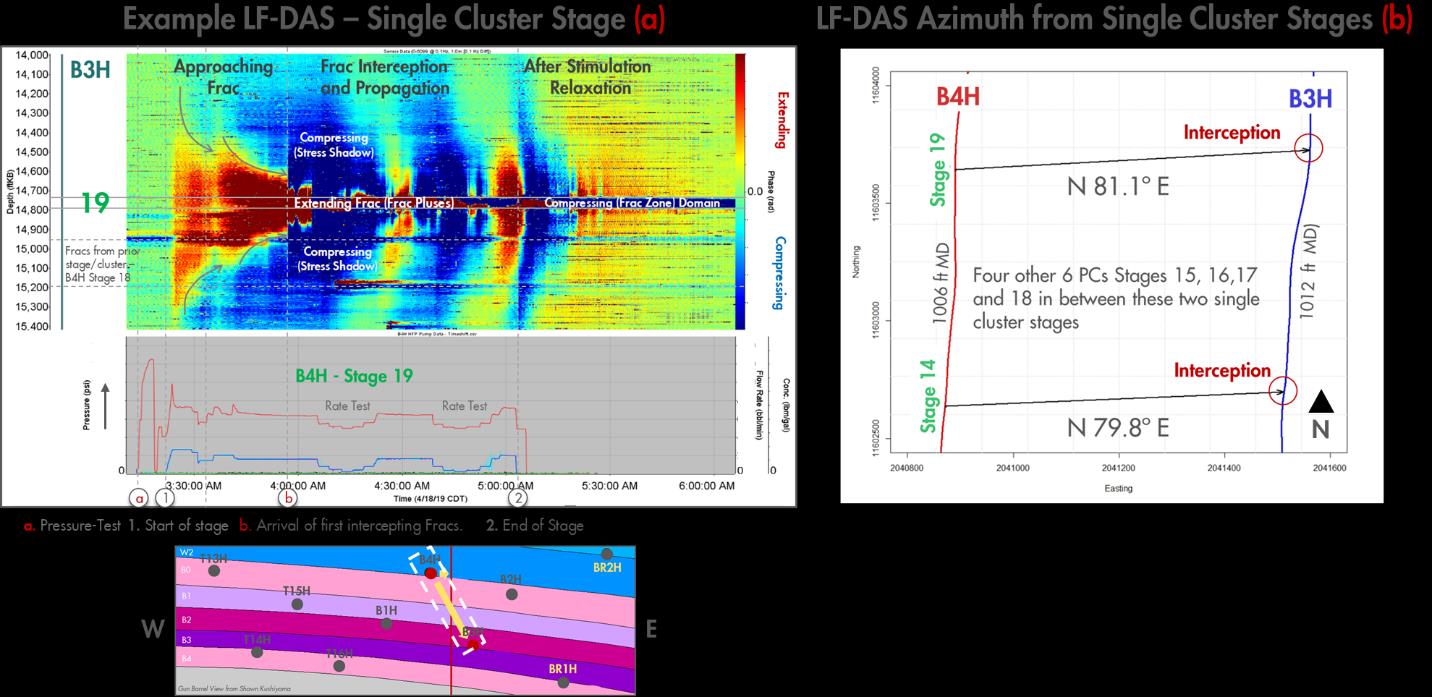 Fig 27 — (a) LF-DAS strain-rate for a single-cluster stage: approaching frac, interception and propagation, then after-stimulation relaxation, with extending frac pulses flanked by compressing stress shadows. (b) Fracture azimuth from two single-cluster stages, N 79.8°E and N 81.1°E, remarkably consistent despite 1,000+ ft of separation.
From this display the report measures fracture azimuth, frac-zone-domain width, time and volume to interception, and propagation velocity. In multi-cluster stages the picture becomes busy: several clusters intercept the monitor well in sequence, and as later fractures arrive the earlier lobes flip from extension to compression, revealing genuinely complex, interfering propagation.
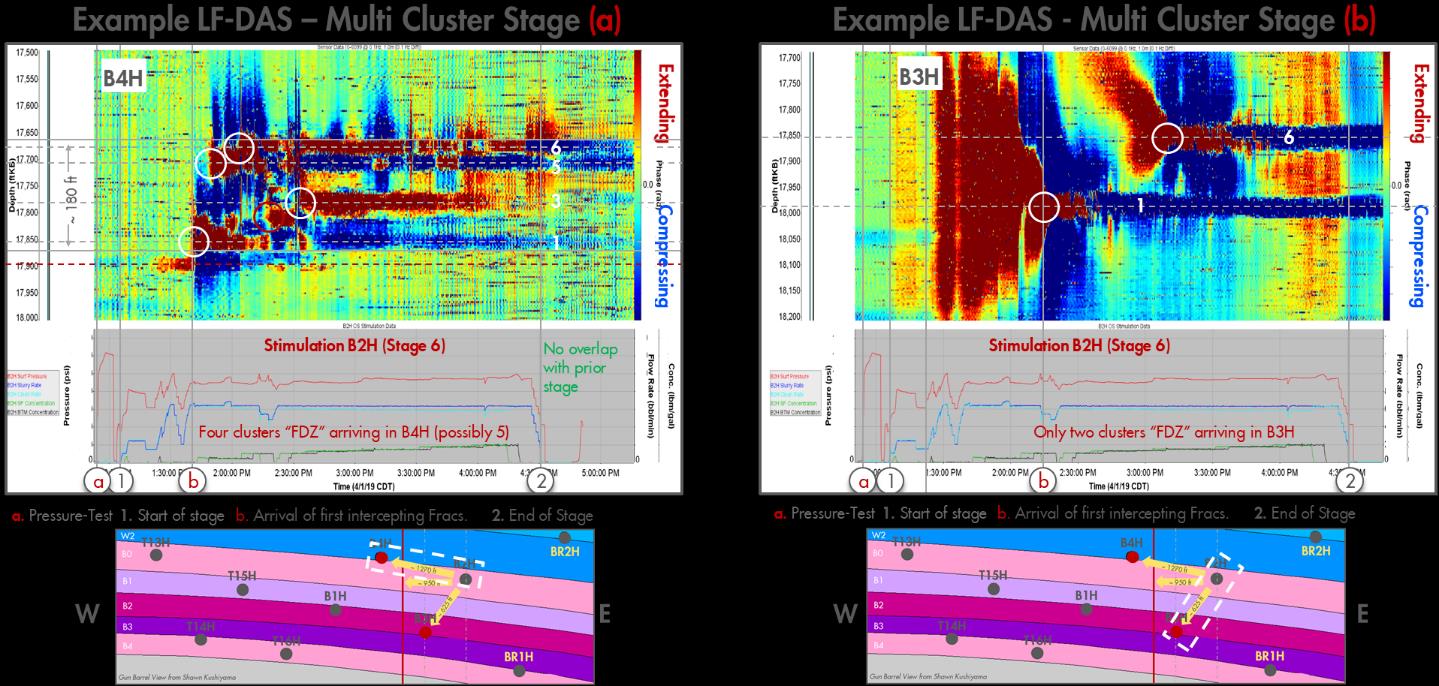 Fig 28 — LF-DAS strain-rate from a six-cluster stage on B2H observed at B3H and B4H. Individual frac-zone-domains are assigned to each cluster by their arrival order and spacing.
Findings
Section titled “Findings”1. Fractures grow tall — vertically, well beyond the target
Section titled “1. Fractures grow tall — vertically, well beyond the target”Significant vertical height growth was mapped, running from the 3rd Bone Spring Sand down into Wolfcamp A2. Fractures do not stay politely inside the landed bench, and that directly governs how tightly wells can be stacked vertically. The report’s cleanest evidence is an integration of three independent methods on the same depth axis — fiber strain, microseismic, and pressure gauges.
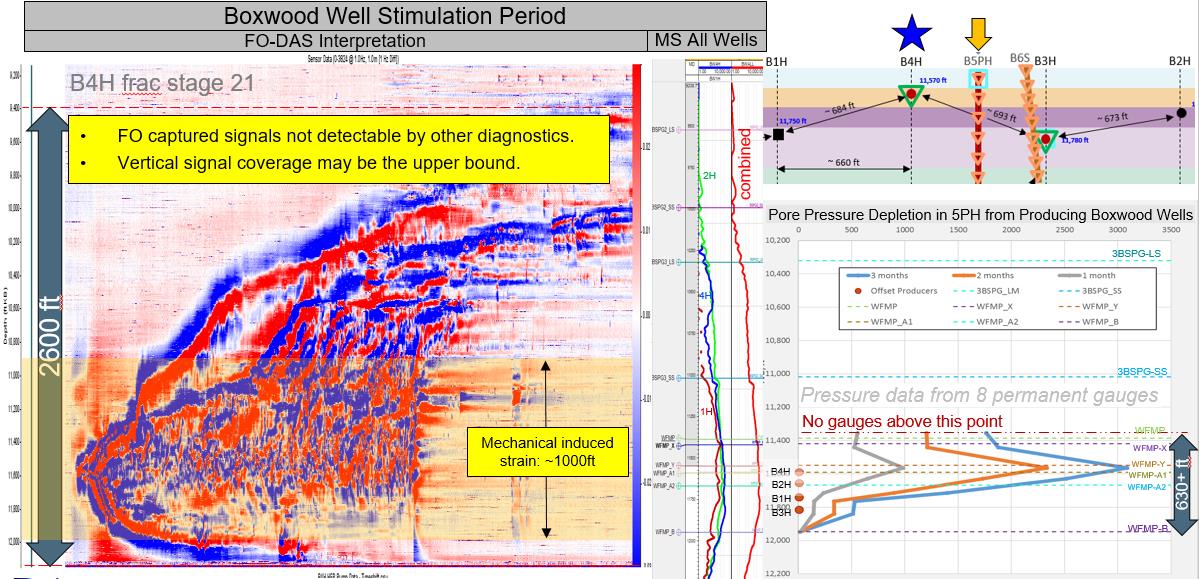 Fig D 17 — Vertical coverage from three independent diagnostics on a shared depth axis: FO-DAS strain during B4H Stage 21 on the left, microseismic in the middle, and pore-pressure depletion from 8 permanent gauges on the right. Fiber consistently gives the tallest estimate.
Fiber strain always reads as the upper bound of fracture height, because it detects small strain changes that other diagnostics miss.
2. Far-field fractures are planar, parallel, and clustered
Section titled “2. Far-field fractures are planar, parallel, and clustered”Away from the wellbore the fracture distribution is not uniform. It organizes into linear fracture corridors set by the stress state, and the report’s geometry conclusions are unusually crisp:
- fractures are not random and have no complex branching architecture
- frac domains are mostly planar and parallel, with azimuth matching the maximum horizontal stress
- domains have well-defined discrete near-field and far-field widths
- domains are vertical and asymmetrical, with strong shallow-upward growth controlled by stress and shallow depletion
- lateral growth is controlled by preexisting fractures and depletion
At 660 ft the induced fractures are contained within a single frac-zone-domain barely wider than the 5 m fiber gauge length. The cores confirmed the clustering: 500 hydraulic fractures counted, occurring in doublets, triplets, and swarms rather than evenly spaced.
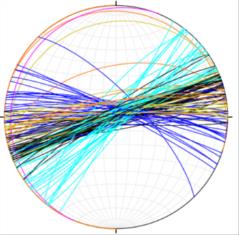 Fig 52 — Hydraulic fractures in the slant core: many are remarkably planar, smooth, and featureless; those cutting carbonate are rougher.
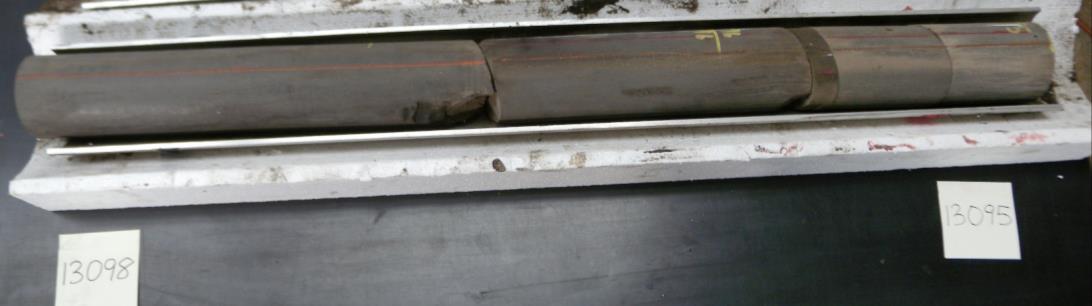 Fig 54 — A four-fracture swarm in Core 2. The leftmost fractures are hydraulic, and the swarm carried some fine sand patches described below.
3. Parent-well depletion biases new fractures
Section titled “3. Parent-well depletion biases new fractures”More than half the child-well stages overlapped depleted parent-well regions. The project demonstrated and quantified how depletion warps new hydraulic-fracture growth toward the low-pressure depleted zones. This is the parent-child problem that costs operators real production, now measured instead of guessed.
4. Microseismic overestimates fracture extent
Section titled “4. Microseismic overestimates fracture extent”Microseismic event clouds came out significantly wider than the fractures seen by LF-DAS. The report interprets part of that excess as the result of pressure diffusion rather than actual propped fractures. Microseismic maps the pressure halo, not only the fracture itself.
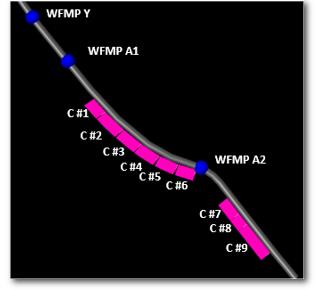 Fig 15 — Microseismic event locations colored by stage. The event clouds are broader than the LF-DAS frac-zone-domains for the same stages.
5. DSS-RFS proved itself as a cluster-scale diagnostic
Section titled “5. DSS-RFS proved itself as a cluster-scale diagnostic”HFTS-2 was one of the first unconventional deployments of Distributed Strain Sensing via Rayleigh Frequency Shift, or DSS-RFS. It is high-resolution strain mapping that resolves behavior cluster by cluster. Shut-in and reopen tests let strain be read as fracture aperture change, and the DSS strain profile lined up with DAS acoustic intensity during stimulation. Near-wellbore frac-zone-domain widths came out between 11 and 15 ft.
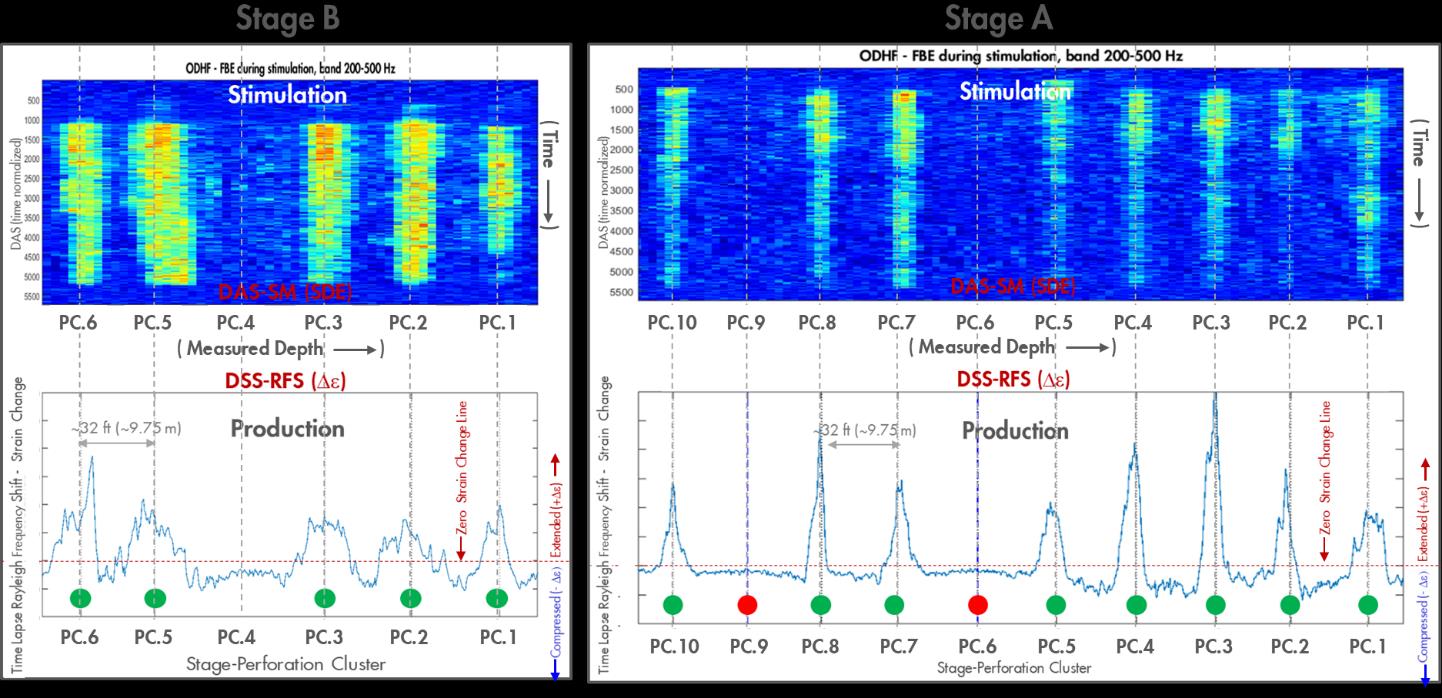 Fig 40 — DSS-RFS strain-change profiles during production shut-in compared with DAS acoustic intensity during stimulation, across two stages with different cluster counts.
Run during production, the same strain measurement becomes a proxy for the vertical depletion profile — fiber strain along the vertical science well maps where pressure is draining, bench by bench.
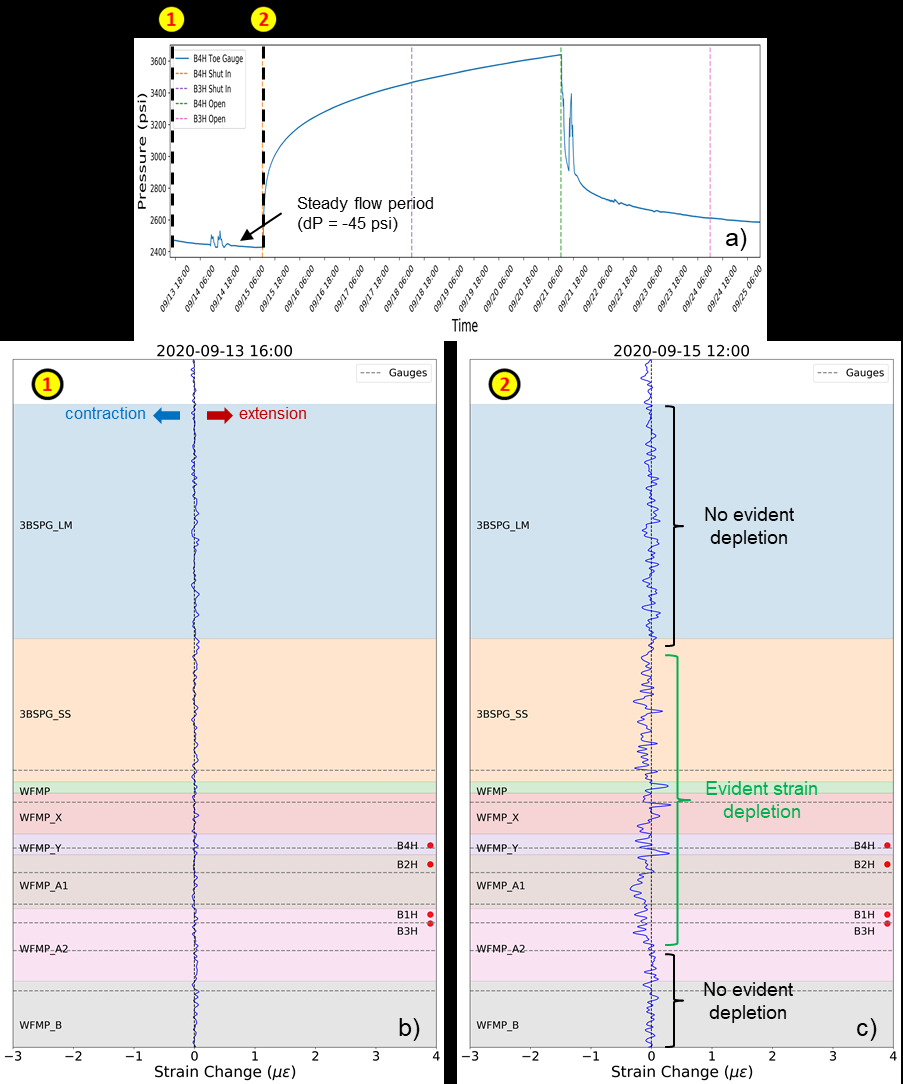 Fig D 18 — Strain-change profiles on the vertical B5PH well during steady flow, showing depletion from the top of the 3rd Bone Spring Sand down to the middle of Wolfcamp A2.
6. The sobering one: proppant barely reaches the far field
Section titled “6. The sobering one: proppant barely reaches the far field”The through-fracture core is the reality check. Away from the wellbore there were no sand packs at all — only sparse, fine proppant grains of 63 to 120 µm, trapped in fracture steps and twist-hackles. Yet proppant was detected at lateral distances beyond 2,000 ft using the GTI proppant-logging tool, which this project validated. Fractures propagate far, but effective propped conductivity in the far field is thin. Most of the injected sand does not stay where the far fractures are.
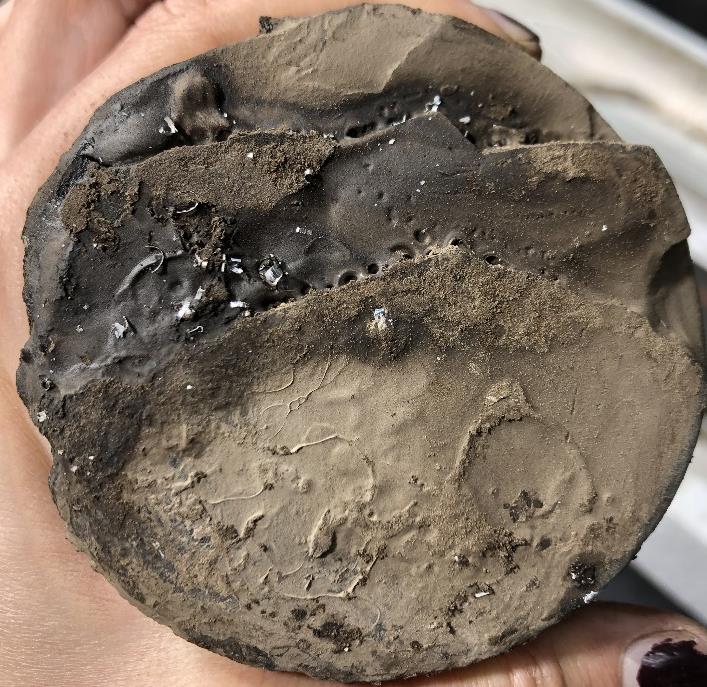 Fig 61 — Fine proppant sand patches on a cleaned fracture face, with grains lodged against steps and twist-hackles. No thick sand packs were found in the far-field core.
Why the rock matters for geophysics
Section titled “Why the rock matters for geophysics”The Wolfcamp target is a tight calcareous and siliceous mudstone interbedded with carbonate, not a sandstone. Core lithology is dominated by mudrock, carbonate, and calcite-filled natural fractures. The only sand in the core is injected proppant. This stiff, low-porosity, carbonate-rich fabric is exactly why time-lapse velocity 4D signals are weak here. That is also why strain-based fiber diagnostics such as LF-DAS and DSS-RFS, rather than seismic velocity, are the workhorse for characterizing these fractures.
The bottom line
Section titled “The bottom line”The headline of HFTS-2 is not a single number. It is a method shift. Permanent multi-well fiber optics — DAS, DTS, and DSS-RFS — calibrated against a cored stimulated rock volume, can map vertical growth, cluster efficiency, parent-child depletion, and propped extent well enough to drive well-spacing and completion-design decisions. Those are the billion-dollar levers in unconventional development. Two warnings run through the report: no single diagnostic tool tells the whole story, and far-field fracture length is not the same as far-field conductivity.
Source: HFTS-2 Final Report, OSTI 1907894, award DE-FE0031577, GTI Energy, 2022. Data public at EDX gti-hfts-2. Figures reproduced from the DOE public-domain final report.